Whether we are producing goods and services, eating, travelling, or entertaining ourselves, our daily activities always emit a certain amount of CO2. When we quantify how many emissions we produce, we use the metric ton of CO2 as a unit, but it is sometimes difficult to imagine what it represents in reality. Together, we will try to understand what a ton of CO2 is equivalent to and how much CO2 we emit.
What is CO2?
CO2, or carbon dioxide, is the most common greenhouse gas present in the atmosphere produced by human activities. It is invisible, odourless, and has a density of 1,964 kg/m3 (0°C, 1 atm). The reason why we care so much about this gas is that it enhances global warming, causes health problems, and accelerates climate change. Although there are several greenhouse gases in the atmosphere, the CO2 equivalent unit (CO2e) is the most commonly used unit to measure the impact of human activities on global warming.
What is a ton of CO2 equivalent to?
It is hard to visualise what the numbers behind carbon emissions really mean, because greenhouse gases are invisible. However, we can compare one ton of CO2 to things and activities we do often, if not daily.
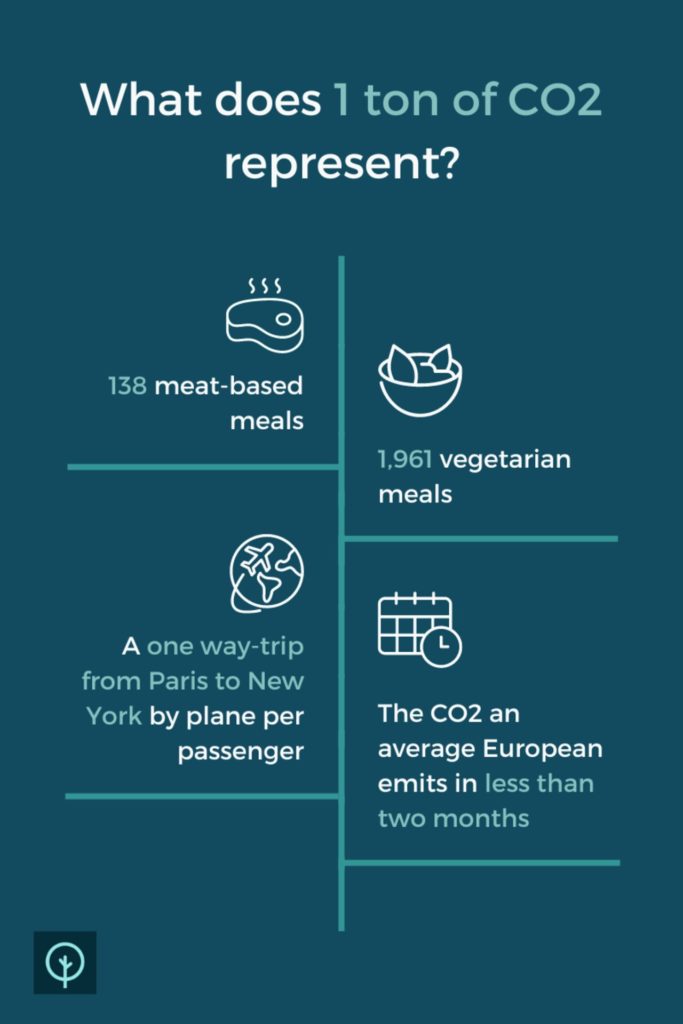
One ton of CO2 is equivalent to 138 meat-based meals. Seems like a lot? Not if you consider that, if you have three meals a day, you are having 1095 meals in total in a year! Vegetarian food, on the other hand, produces less carbon dioxide, and one ton of CO2 corresponds to 1,961 vegetarian meals. Here is another example. Aeroplanes emit much more carbon dioxide than trains or cars, so much so that every passenger on a one-way trip from Paris to New York emits one ton of CO2. Lastly, if you live in Europe and you lead an average lifestyle, then you will have probably already emitted more than one ton of CO2 by the end of February.
But what does a ton of CO2 look like?
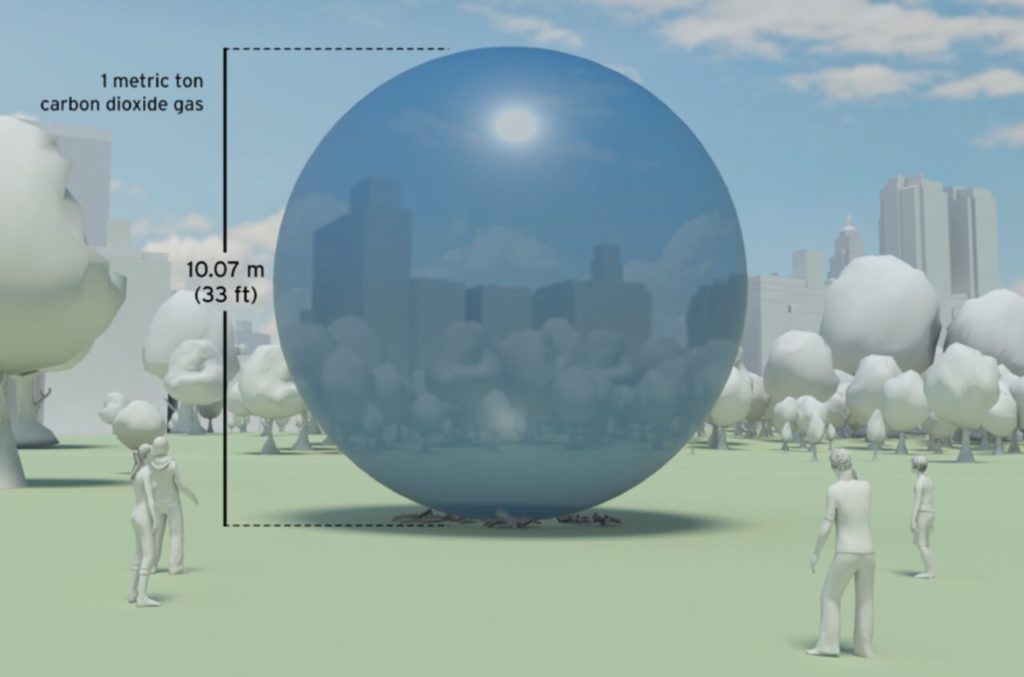
Carbon Visuals has created graphic representations of CO2 emissions that help us better visualise the extent of greenhouse gases production. In the following picture, we can see how big one ton of CO2 is.
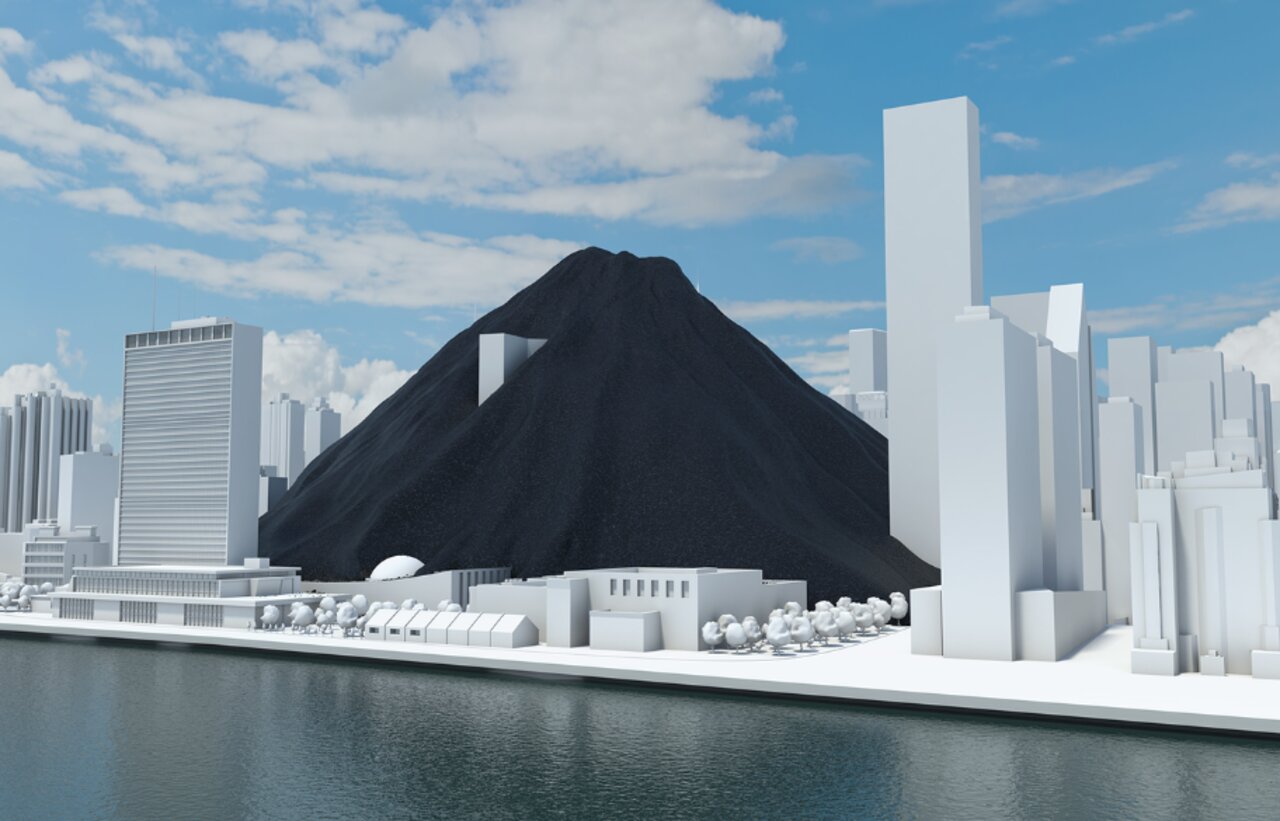
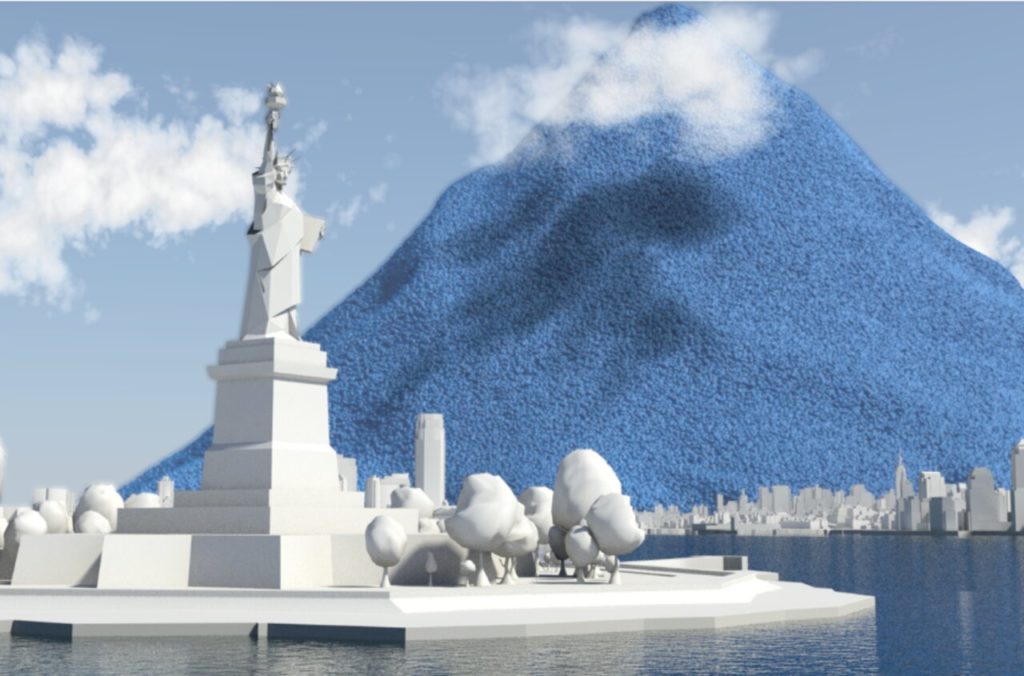
And how much CO2 do we emit in a day? In the picture below, you can see the amount of CO2 produced each day by human activity in 2012. As you can see, New York city is fully covered by a massive pile of CO2 (one sphere equals one ton), around 107 million tons. We will leave to your imagination how bigger the pile must be in 2023, with the world population continuously increasing.
How much CO2 do we emit?
As of 2021, the global population emits over 37 billion metric tons each year, with high and upper-middle income countries being the largest emitters. In Europe, we emit 5,43 billion tons of CO2 in a year. In other words, every European inhabitant emits around 7,2 tons of CO2 per year, with Belgium’s emissions being slightly above average.
Now, let’s put these numbers into perspective. To meet the Paris Agreement goal of limiting global warming to 1.5°C, we should emit less than 2.3 tons of CO2 per person every year.
When dealing with quantification of CO2 emissions, we also have to consider that national inventories are only based on the generation of greenhouse gases within the national territory. However, a more accurate carbon footprint would include the following elements:
- The direct greenhouse emissions of every household;
- Emissions from national production of goods and services for national demand (including energy);
- The emissions from national production associated with exports;
- The greenhouse gases produced by imported goods and services, whether they are for intermediate consumption by businesses or for final use by households.
As you can see, the carbon footprint provides a more comprehensive picture of the emissions produced by a country. As an example, the emissions per capita based on France’s national inventory are around 5 tons of CO2, but the carbon footprint based on broad consumption reaches around 11 tons, almost double of what the national inventory states.
Do you want your business to make a difference?
Tapio is a carbon accounting platform that will help your business reach its sustainability goals. Estimate your company’s impact for free, in just 3 minutes.